


Deployment
OpenObserve
Open source; self-host on your cloud or use OpenObserve Cloud.
Owlpane
Hosted SaaS; dedicated cell on Scale and Enterprise.
Owlpane / Solutions / vs. OpenObserve
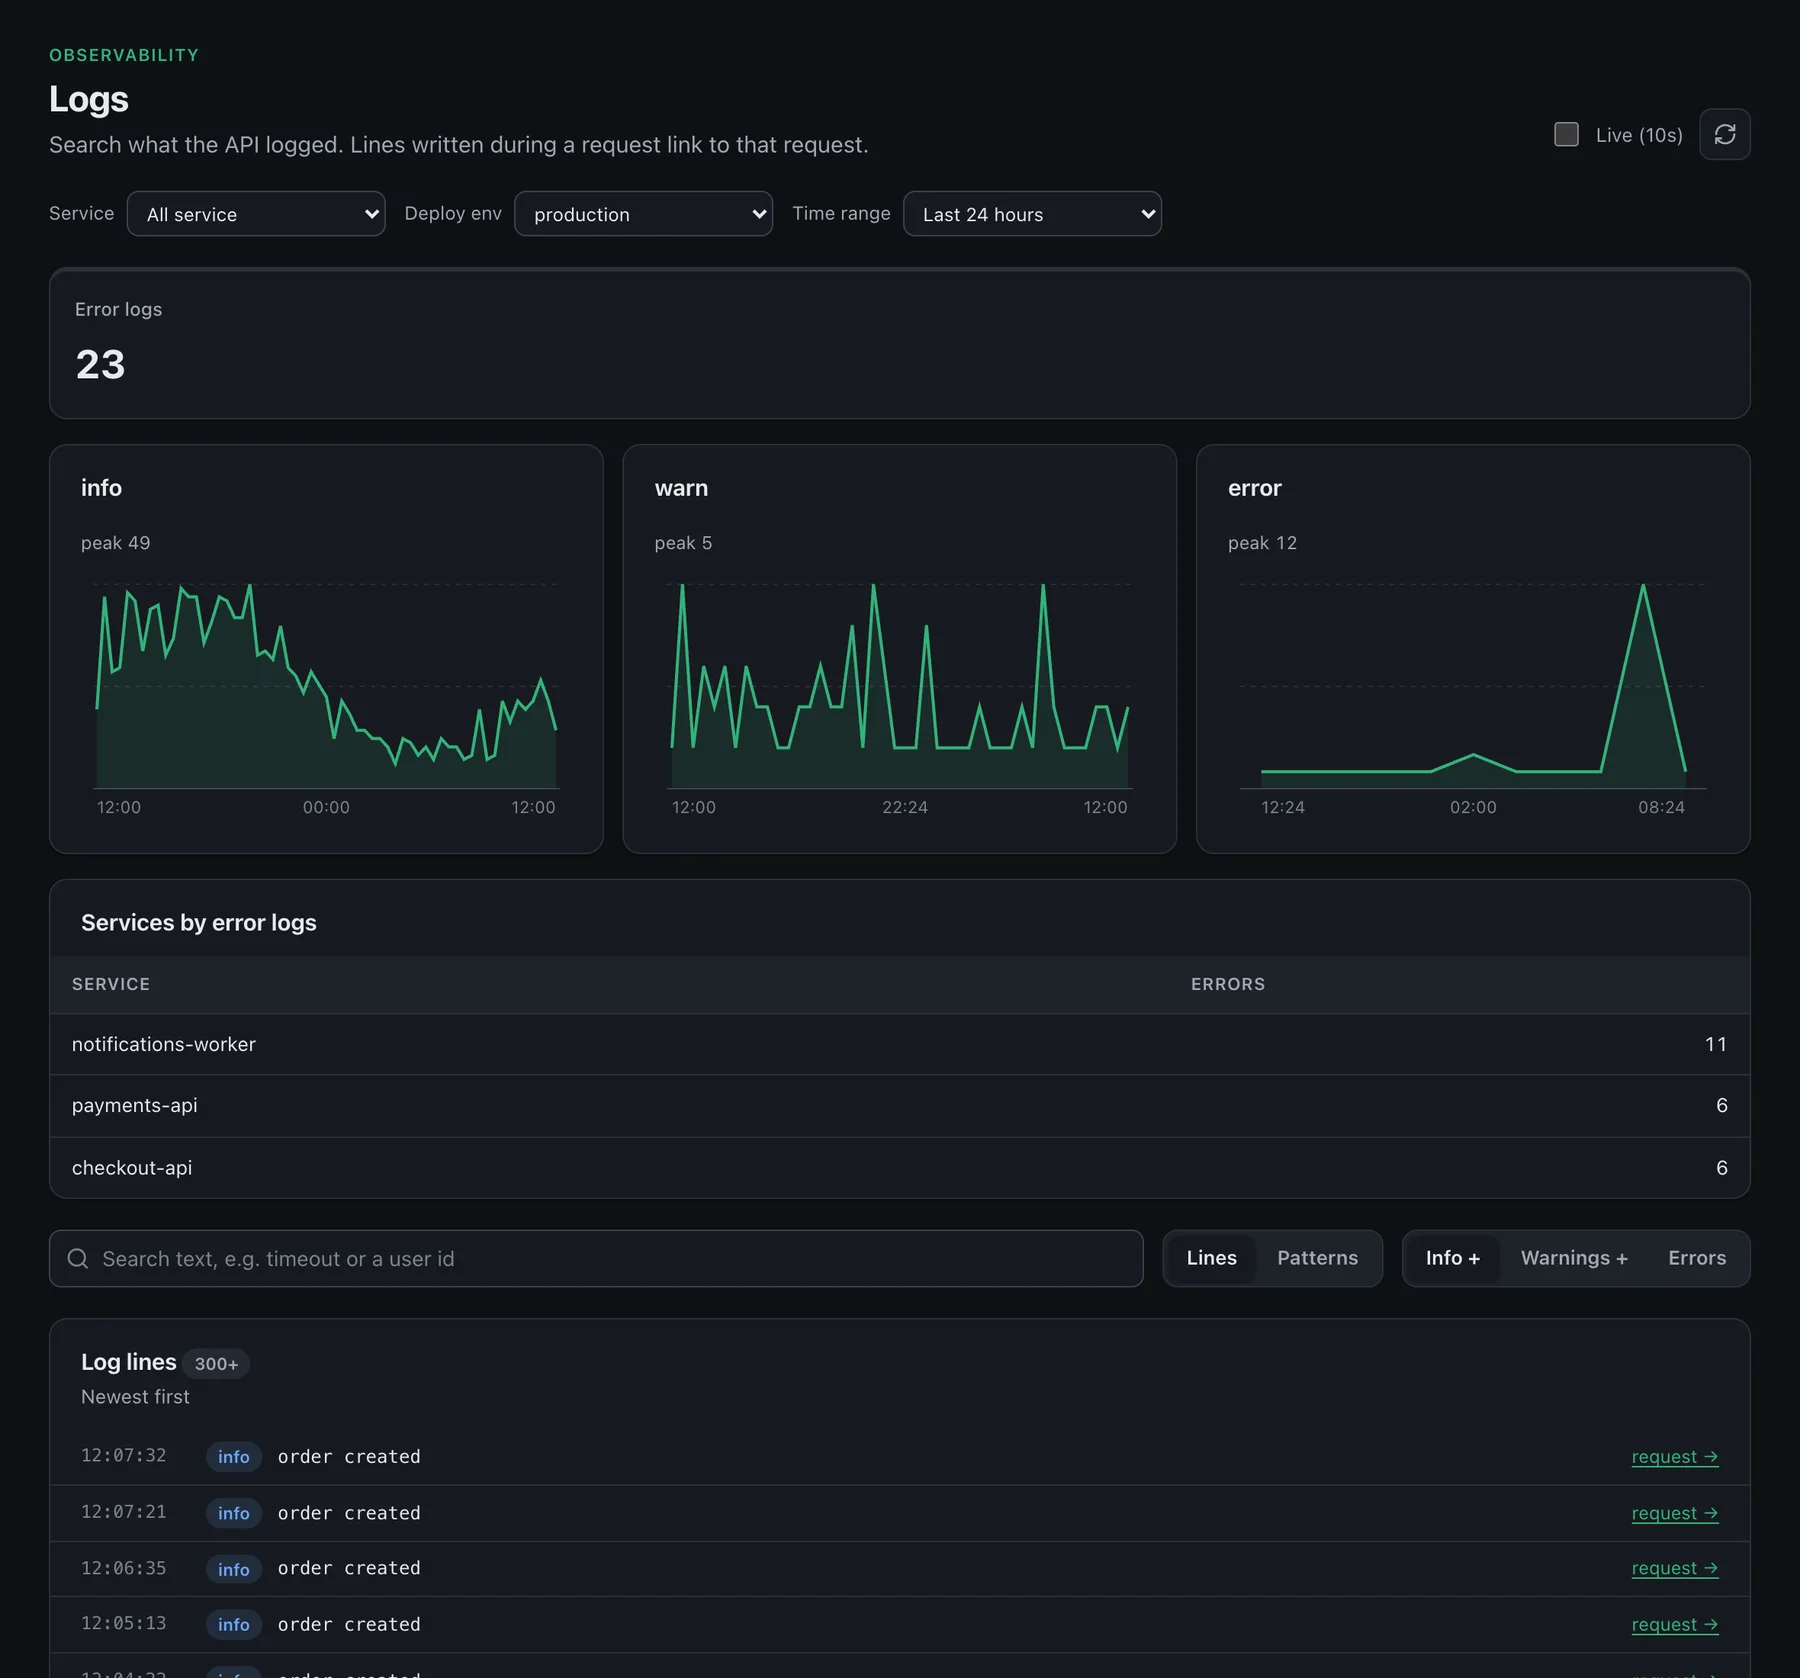
Moving from another tool · built on OpenTelemetryOpenObserve is open source, can run on your object store, and markets unified logs, metrics and traces with SQL search and AI-assisted investigation. Owlpane is a hosted product with Kubernetes operations, SLO burn-rate alerts and Carbon on the same telemetry — without running the datastore yourself.
Switching, honestly
Keep
OpenObserve if you must self-host on your bucket, or send OTLP to both while you compare.
Gain
Hosted operations, incident timeline, Kubernetes explorer with actions, SLO burn-rate alerts and Owlpane Carbon — without sizing Rust ingest nodes or object-store lifecycle rules.
Give up
Open-source licence and extreme storage-efficiency claims on your own hardware. We do not ship a downloadable single binary you run at petabyte scale on your S3.
What you use
Energy and CO₂e from the telemetry you already send, measured or estimated.
Carbon →How it works
Add one exporter to your OpenTelemetry Collector and your current tool keeps receiving everything it does today.
Run both on the same service for a week.
Self-host OpenObserve if bucket control is mandatory; choose Owlpane if you want hosted linked ops and Carbon.
Side by side
| OpenObserve (typical) | Owlpane | |
|---|---|---|
| Hosting | Self-host (your bucket) or vendor cloud | Hosted service |
| Ingest | OTLP, Prom, many agents | OTLP and Prometheus remote write |
| Ops burden | You operate ingest, query and storage tiers (self-host) | Vendor-operated; you send telemetry |
| Kubernetes depth | Kubernetes monitoring integrations | Cluster explorer with pod grid and actions |
| Entry point | Free tier / open source; cloud pricing varies | Free up to 10 GB a month; Team is $29 including 50 GB |
OpenObserve pricing and cloud tiers change frequently; confirm on openobserve.ai/pricing in October 2026. Storage-efficiency benchmarks compare architectures — validate on your own workload before switching. OpenObserve · Estimate Owlpane with the cost calculator
What matters most
Deployment
OpenObserve
Open source; self-host on your cloud or use OpenObserve Cloud.
Owlpane
Hosted SaaS; dedicated cell on Scale and Enterprise.
Unified signals
OpenObserve
Logs, metrics and traces in one engine with SQL and correlation features.
Owlpane
Logs, metrics and traces linked in the console; Grafana can read metrics via Prometheus-compatible endpoint.
AI investigation
OpenObserve
AI SRE and assistant features marketed for autocorrelation and incident narrative.
Owlpane
Ask is search-driven with visible charts; no autonomous remediation or agent that changes production.
Pricing shape
OpenObserve
Cloud and enterprise licensing; self-host has no vendor ingest fee but infra and ops cost.
Owlpane
GB ingested; Team $29 including 50 GB, then $0.35 per GB; no per-seat fee.
Carbon
OpenObserve
Not a headline product on openobserve.ai today.
Owlpane
Included on Team and above, labelled measured or estimated.
Comparisons reflect publicly available information as of September 2026 and our own product today, and may change. Datadog, New Relic, Grafana, Dash0, Better Stack, Amazon CloudWatch, AWS, Sentry, Dynatrace, Kubeshark, Checkly, PagerDuty, SigNoz, Kubernetes, OpenTelemetry, Prometheus and other names are trademarks of their respective owners; Owlpane is not affiliated with or endorsed by them.
Standard OpenTelemetry in, so you can try Owlpane beside what you run today.
Every new workspace starts with a 14-day Team trial: 50 GB of ingest a month and 30-day retention. No card to start. Documentation · Pricing · Pricing questions