Owlpane / Products / Dashboards
Telemetry · built on OpenTelemetryChart any metric your apps send — and share the exact view with a link.
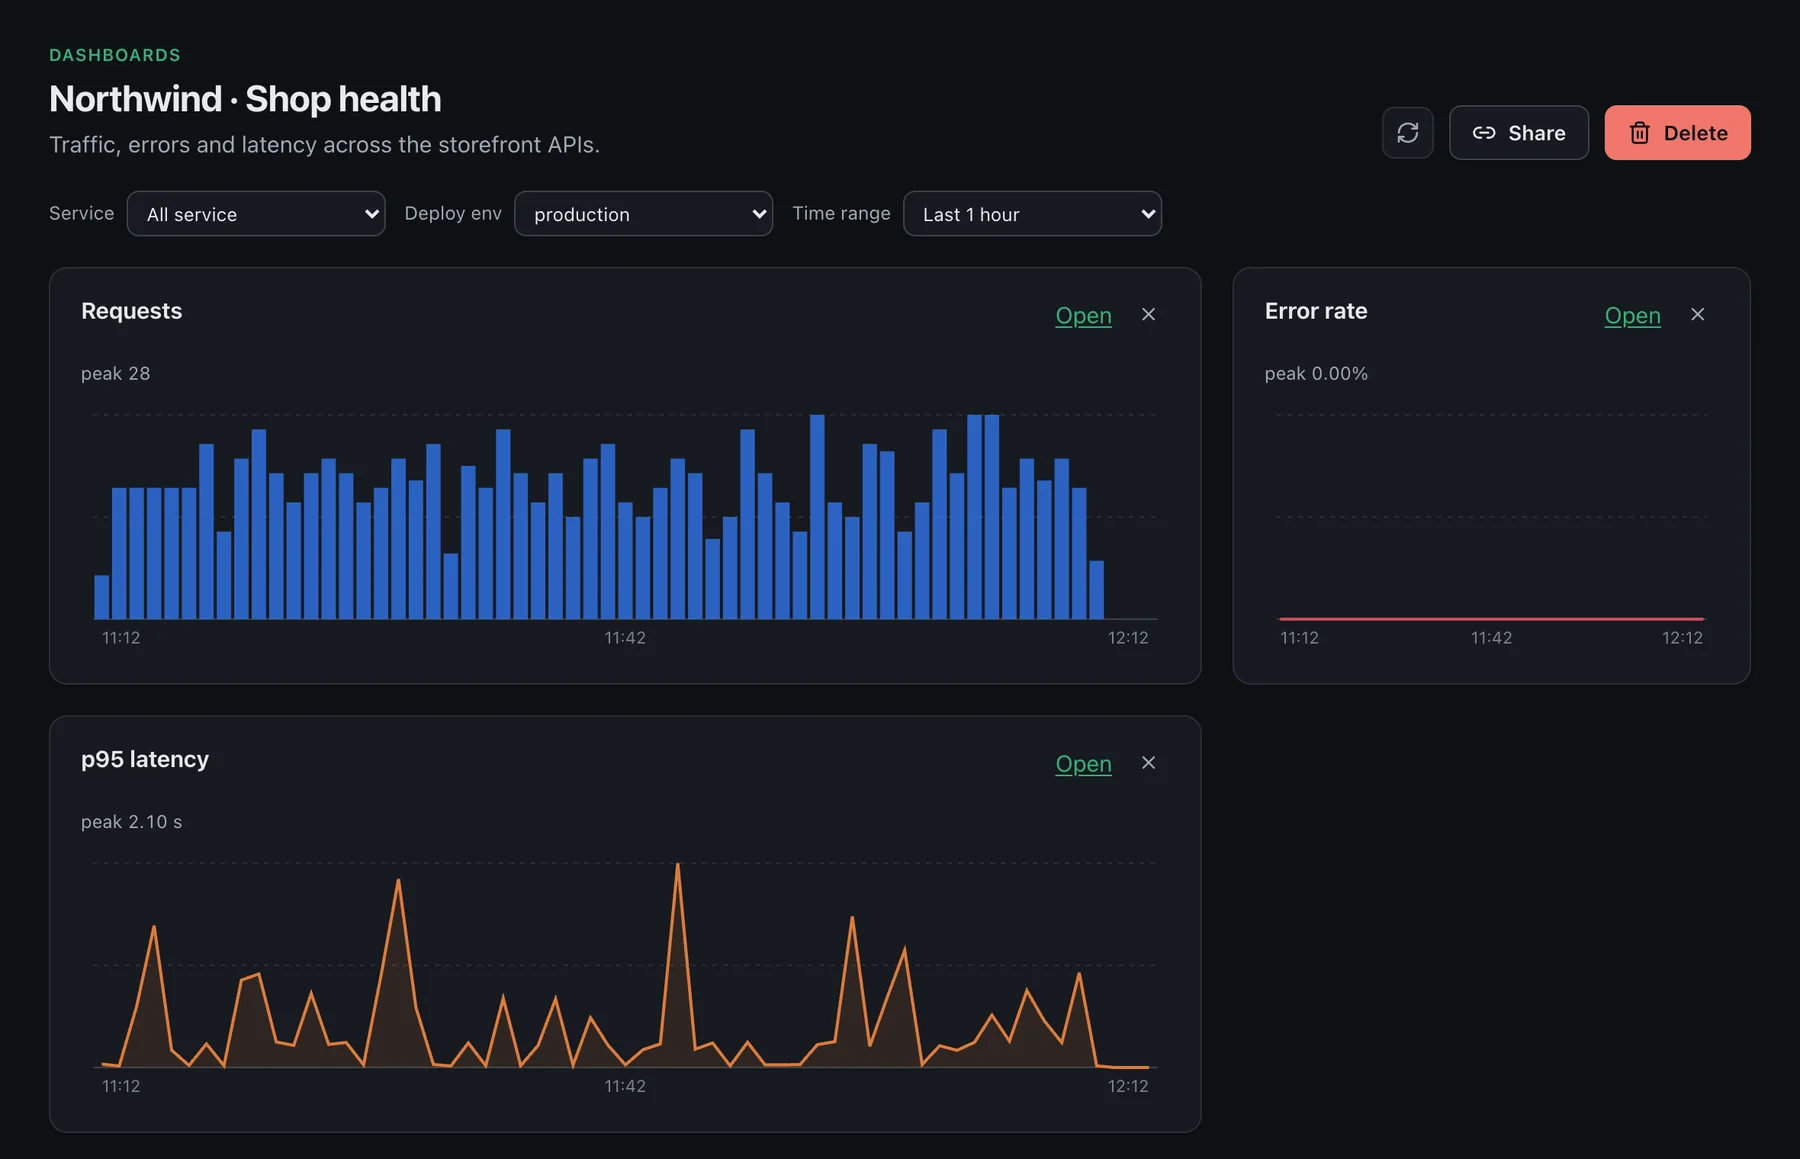
Build named dashboards for a wall display or a weekly review, explore any metric ad hoc, and keep everything exportable as code.
What you get
Dashboards & metrics, in detail

Dashboards
Named sets of charts everyone in the workspace can view; owners and admins edit. Share a read-only link.

Metrics explorer
Pick an aggregation, group by an attribute, filter on others. The view lives in the address bar, so you can send it to a colleague.
Marketplace templates
Curated dashboard templates and integration starting points.
Export as Terraform
Dashboards, alert rules, SLOs and uptime checks export as Terraform so they can live in version control.
Prometheus-compatible
Prometheus remote write in; a Prometheus-compatible read endpoint so Grafana can query Owlpane metrics.
How it works
From zero to data in three steps
Send
OTLP or Prometheus remote write.
Explore
Group and filter in the explorer until the chart answers the question.
Save
Pin it to a dashboard, share it, or export it as code.
How it compares
Honest about where we are today
Comparable to
Where Owlpane is narrower
- PromQL support is a read endpoint, not full parity, and there is no library of community dashboards.
Comparisons reflect publicly available information as of September 2026 and our own product today, and may change. Datadog, New Relic, Grafana, Dash0, Better Stack, Amazon CloudWatch, AWS, Sentry, Dynatrace, Kubeshark, Checkly, PagerDuty, SigNoz, Kubernetes, OpenTelemetry, Prometheus and other names are trademarks of their respective owners; Owlpane is not affiliated with or endorsed by them.
More from Owlpane
Everything shares one pane
Try Dashboards beside what you run today.
Standard OpenTelemetry in, so you can send a copy and compare. Nothing proprietary to migrate away from later.
Every new workspace starts with a 14-day Team trial: 50 GB of ingest a month and 30-day retention. No card to start. Documentation · Pricing · Pricing questions