Owlpane / Solutions / SRE & platform
Teams · built on OpenTelemetryWhen something breaks at 3am, start with what changed—not another dashboard.
OpenTelemetry-native traces, logs, and metrics with multi-window SLO burn alerts, grouped incidents, and an evidence-first investigation timeline. Your runbook links on the alert; Ask and MCP stay read-only on your data.
The problem
Why this is hard today
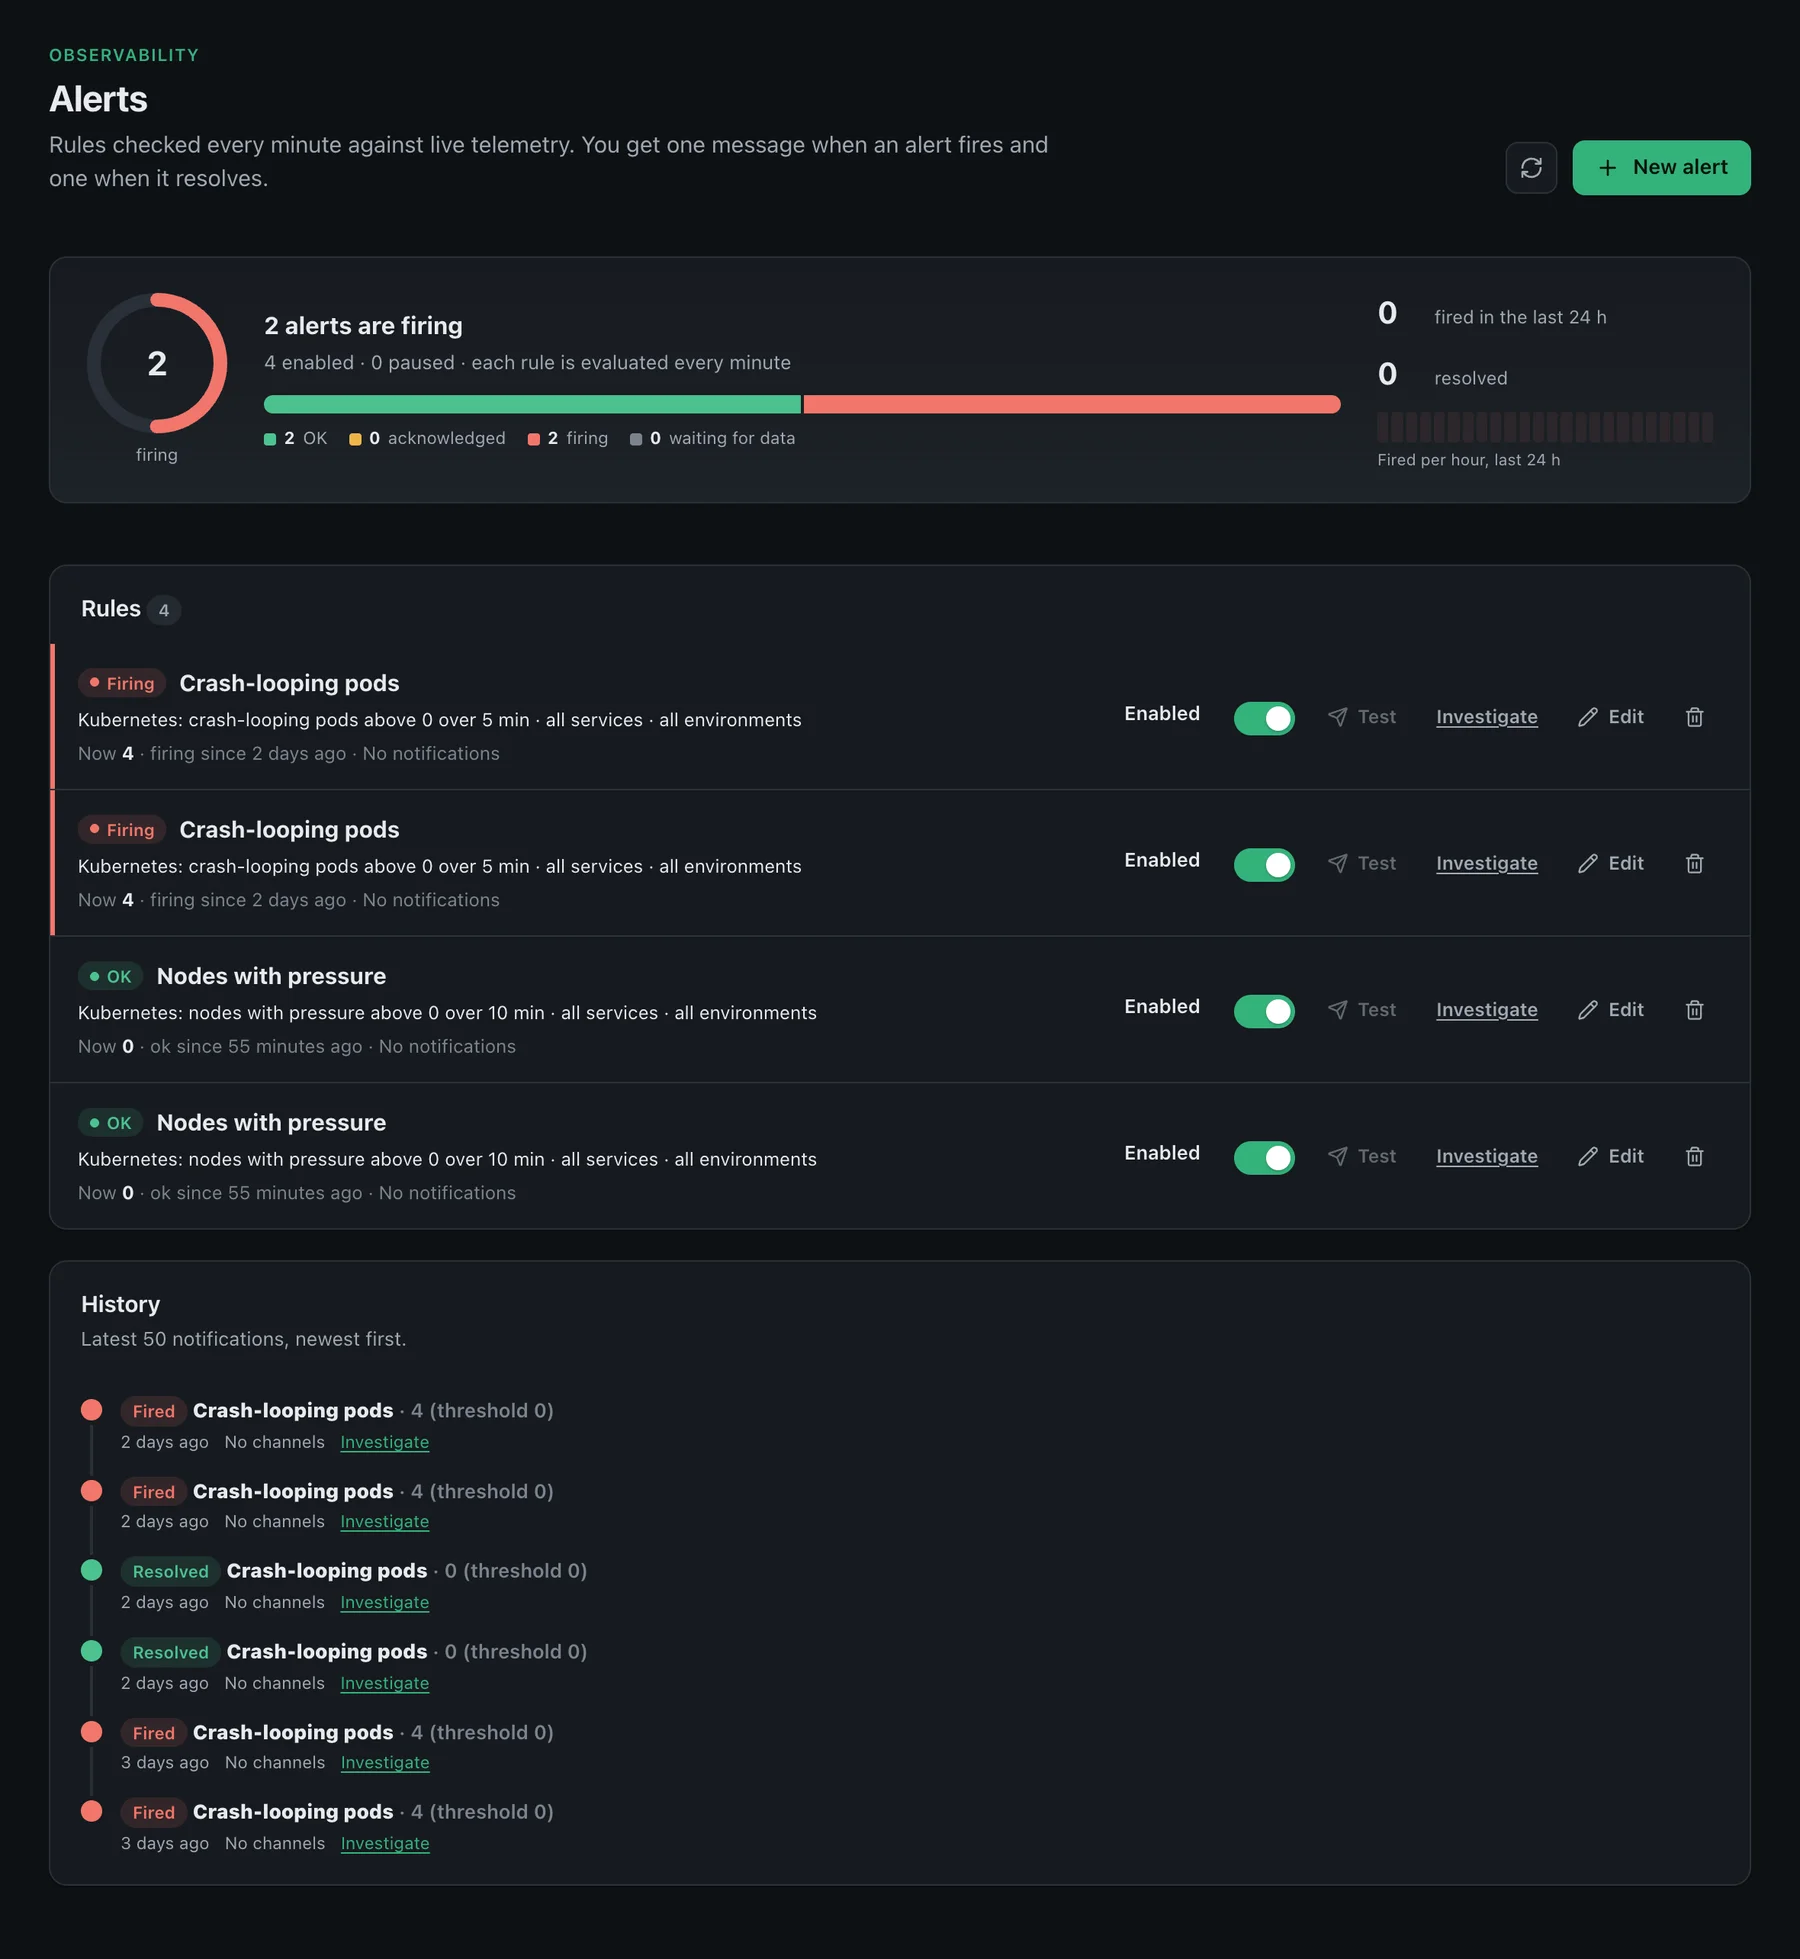
Alert fatigue
The same alert repeats every minute until someone mutes the channel.
Two views of one server
Infrastructure metrics and application traces live in different tools.
Config by clicking
Alert rules and dashboards drift because they are not in version control.
What you use
Built from features that ship today
Alert rules
One message when an alert fires and one when it resolves — never a wall of repeats.
Alerting & SLOs →Alert channels
Email, Slack, Teams, Discord, Google Chat, PagerDuty, Opsgenie, webhooks, Jira and ServiceNow.
Alerting & SLOs →SLOs
Error budgets and burn-rate alerts over a rolling window, with burn history and deploy markers.
Alerting & SLOs →
Databases
PostgreSQL, MySQL and MongoDB from agent integrations, plus databases discovered from APM client spans.
Infrastructure →
Cluster explorer
A paginated inventory of workloads, services, ingresses and policies, so nothing is silently cut off.
Kubernetes →
How it works
Three steps
Connect
Helm values for Kubernetes, or a stand-alone OpenTelemetry Collector for VMs and Docker.
Define
Set SLOs, alert rules, and a primary escalation policy; route them to your existing channels.
Codify
Export to Terraform and review changes like any other code.
Questions
Does Owlpane replace PagerDuty?
Will AI run kubectl for me?
How do I version alert rules and SLOs?
Another proprietary agent tax?
Will alert spam kill on-call?
Why not wait for SLO tools that alert too late?
Where Owlpane is narrower
- Ask and MCP do not remediate; no autonomous kubectl.
- Indexed RAG runbooks, Slack interactive ack, and BYOK for AI index are roadmap—not GA.
- A focused integration set rather than a huge catalogue; no cloud-account linking.


Send a copy of your telemetry. Change nothing else.
Standard OpenTelemetry in, so you can try Owlpane beside what you run today.
Every new workspace starts with a 14-day Team trial: 50 GB of ingest a month and 30-day retention. No card to start. Documentation · Pricing · Pricing questions